Urban Fictions
A class / workshop that explores the impacts of increasing access to our personal data by taking the participants' own data trails as raw material for observation, analysis and speculation.
Digital devices – and the networks they run on – have taken over our everyday lives. And while they help to navigate and interact with the city, they also generate increasingly revealing data trails and behavioral traces wherever we go.
Urban Fictions investigates the potential impacts of increasing access to our personal data by letting the students observe each other through their own personal data.
It creates a new methodology to speculate about the everyday future impacts of the increasing availability of knowledge in form of our personal data.
As part of the Urban Fictions class students are guided through hands-on data visualization exercises of a variety of datasets that they, as a class, are creating through their daily routine in the city. These exercises run from initially observing each other using their eyes and ears only to visualizing the behaviors of the class as a whole entity based on their aggregated personal data trails.
How will the increasing access to our personal information alter the ways we interact with one another and cities?
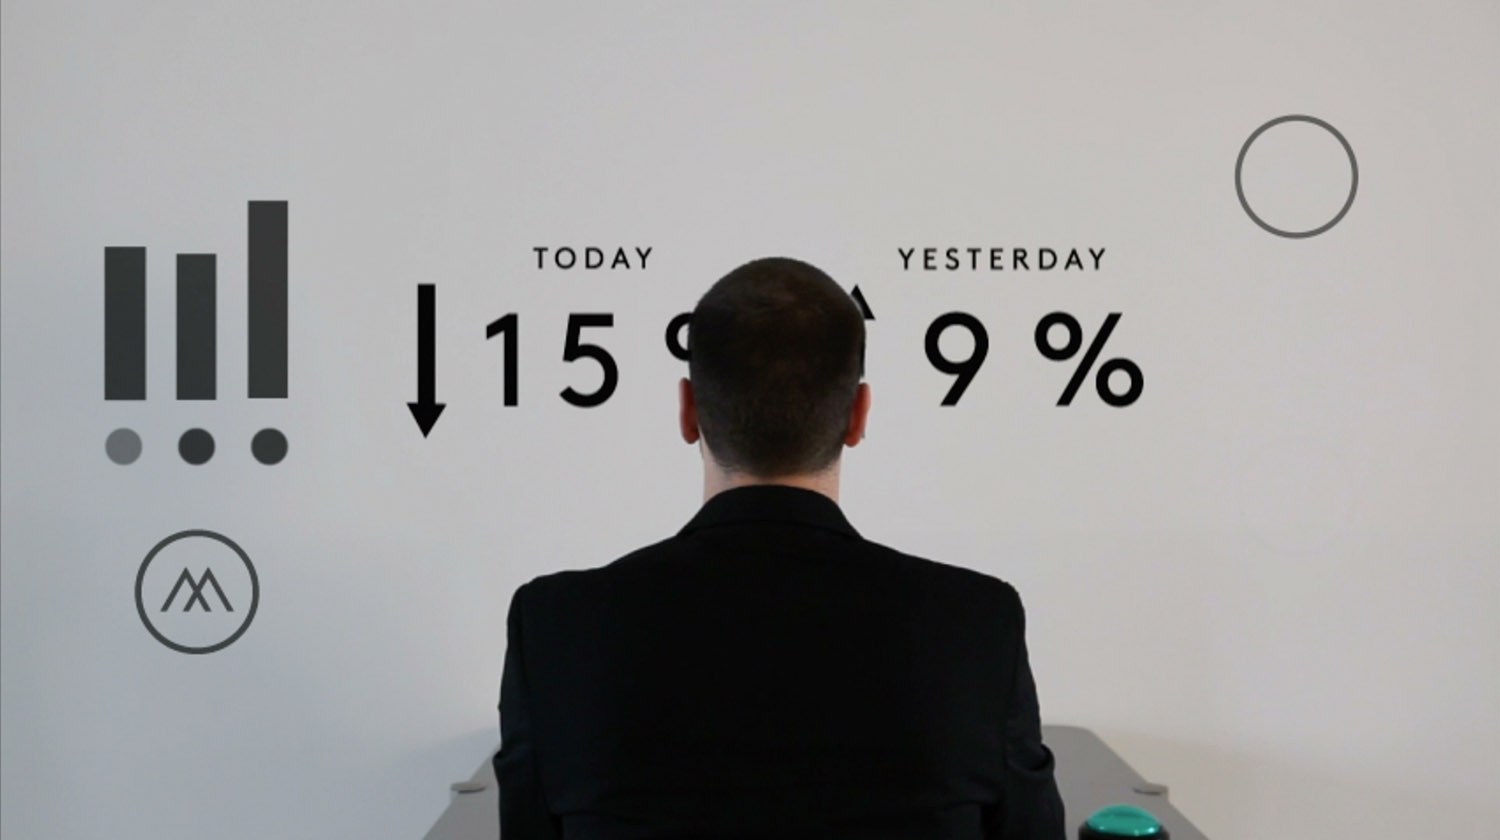
Personal Ad Futures - Hypertailored advertising in public space
Inspired by this experiential perception of their own patterns and behaviors, the students then move on to speculate on the future impact of this ever-presence of data and knowledge by developing data-driven and future-based “interaction stories,” built on concrete scenarios and storytelling devices.
These scenarios manifest their thinking and serve as starting points to trigger new discussions around our potential future everyday.
Unlike most contemporary data visualization classes, where participants are the ones observing through data, here students analyze each other’s personal ‘data material’ to generate first-hand experiences of what it means to observe – and be observed – through data.
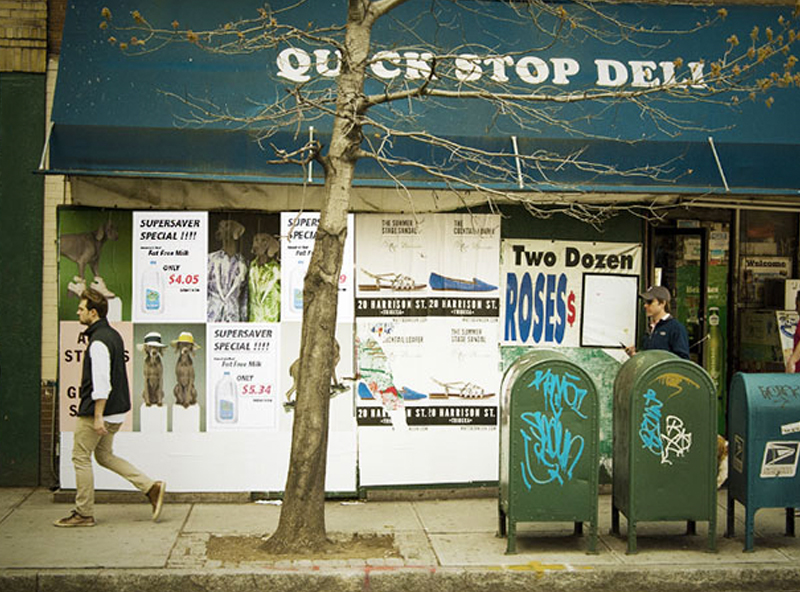
The class starts with a personal exercise: Students are asked to secretly observe a classmate for a week using only their eyes and ears as sensors. Following this data gathering period, they present their classmate in a hand drawn visualization to the class.
In times of technologically-driven data analyses, this low-fi approach forces students to take a step back and develop a sense and sensitivity for their co-students and behaviors associated with data gathering.
At the same time, this method further highlights some of the ‘soft’ factors of human behavior that can’t yet be traced, tracked, or analyzed.
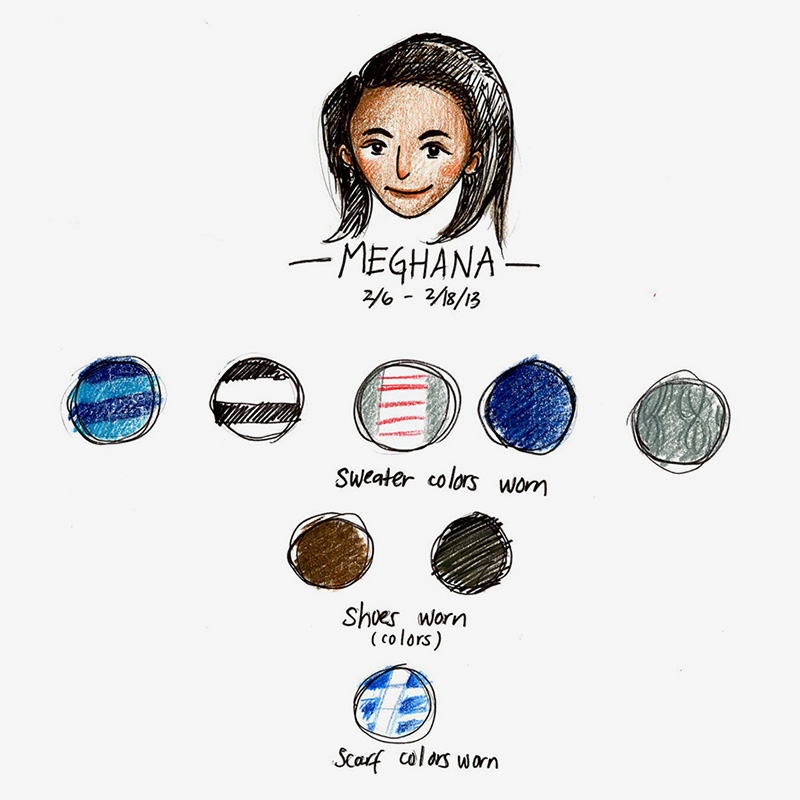
Initial observation using eyes and ears only
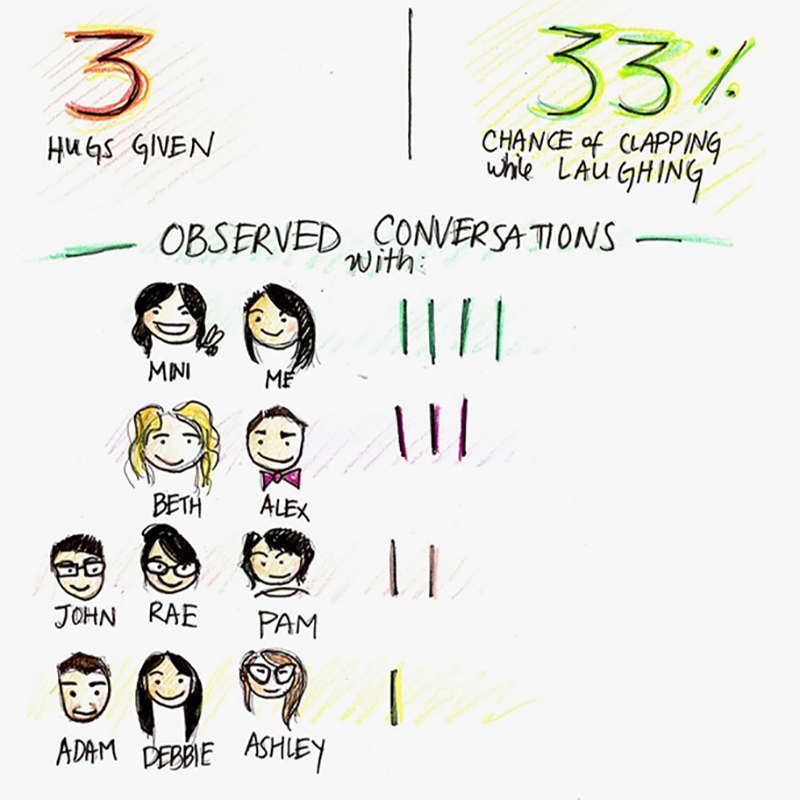
Initial observation using eyes and ears only
Heading into the realm of digital observation, students then share their comprehensive location data with each other. These data trails were collected over the course of three months, prior to the start of class, using the Moves app.
Students are encouraged to glean input from Facebook, Google et al to interpret the routes and lives of their fellow students. The results are then collated into a poster that introduces the student in question as seen through their personal data.
This switch from mere observers, working with data, to being a subject of observation themselves - presented to the entire class as a data construct - creates a powerful shift of perspective and perception.
It makes the students realize just how much data they generate during their daily routines – and how powerful the potential for correlations and insights, but also potential inaccuracies, can be.
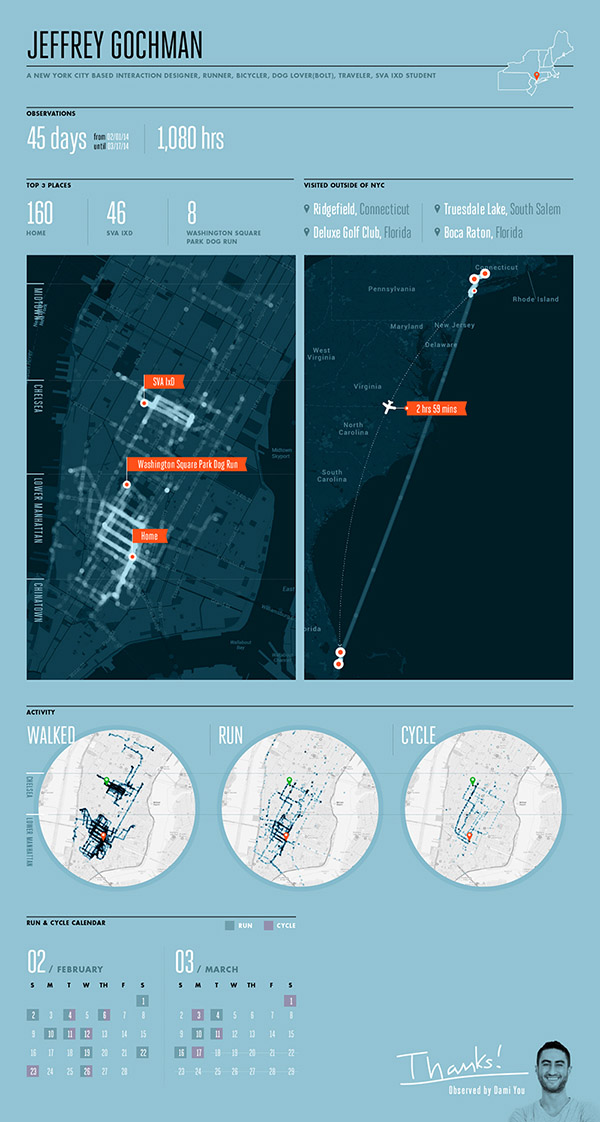
Initial visualizations using data of one person
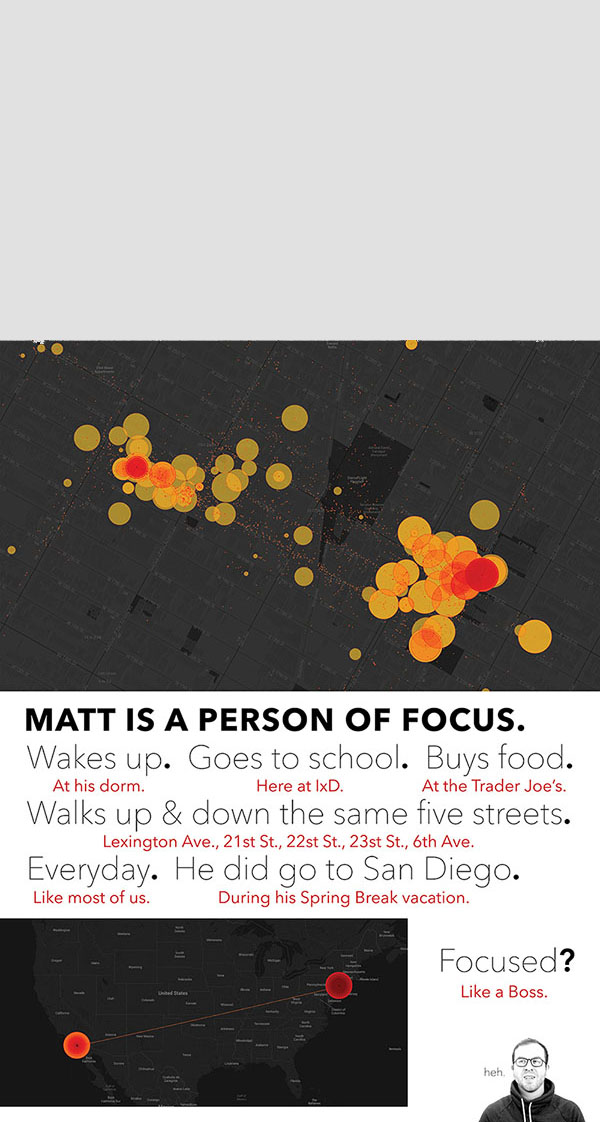
Initial visualizations using data of one person
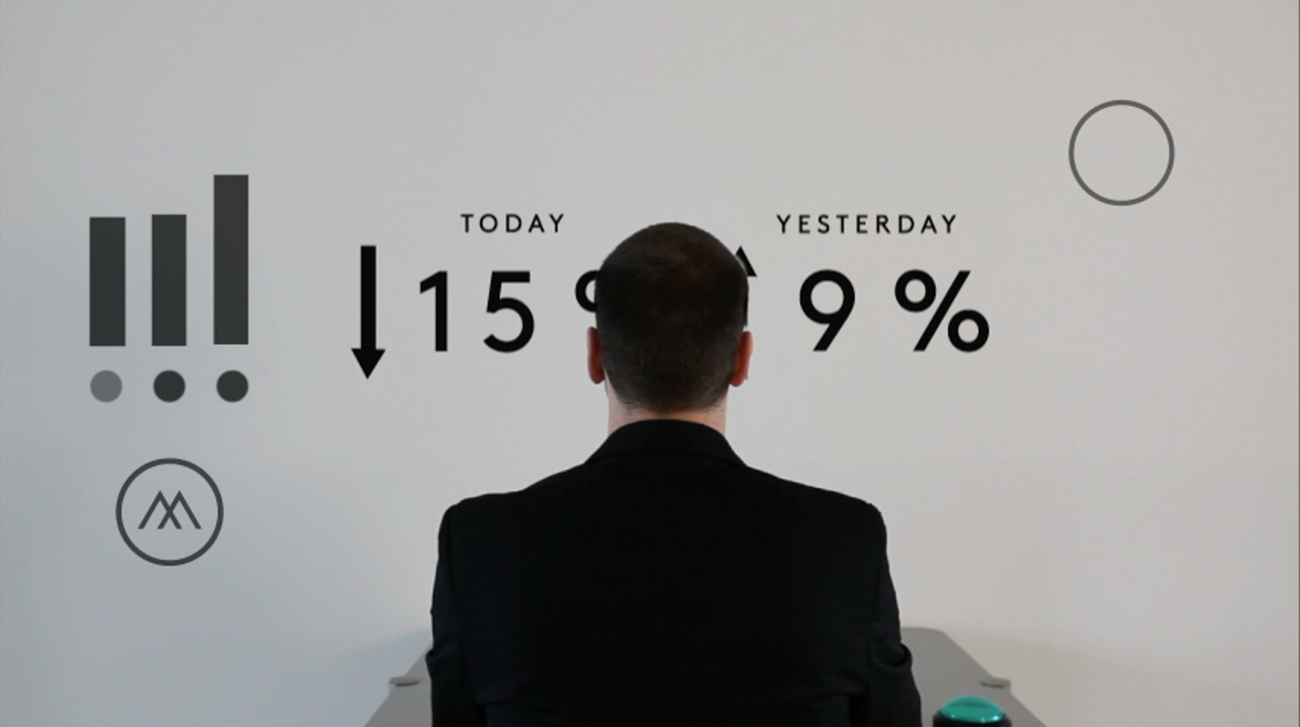
Moving from the individual to the crowd, the participating students then visualize the aggregate data of their class to create a class dashboard that traces and tracks the behaviors and interactions of the class as a whole.
Understanding the data that they – as a closely connected social group – generate through every movement, action, and interaction reveals surprising insights that shore up the understanding of what it means to observe and be observed.
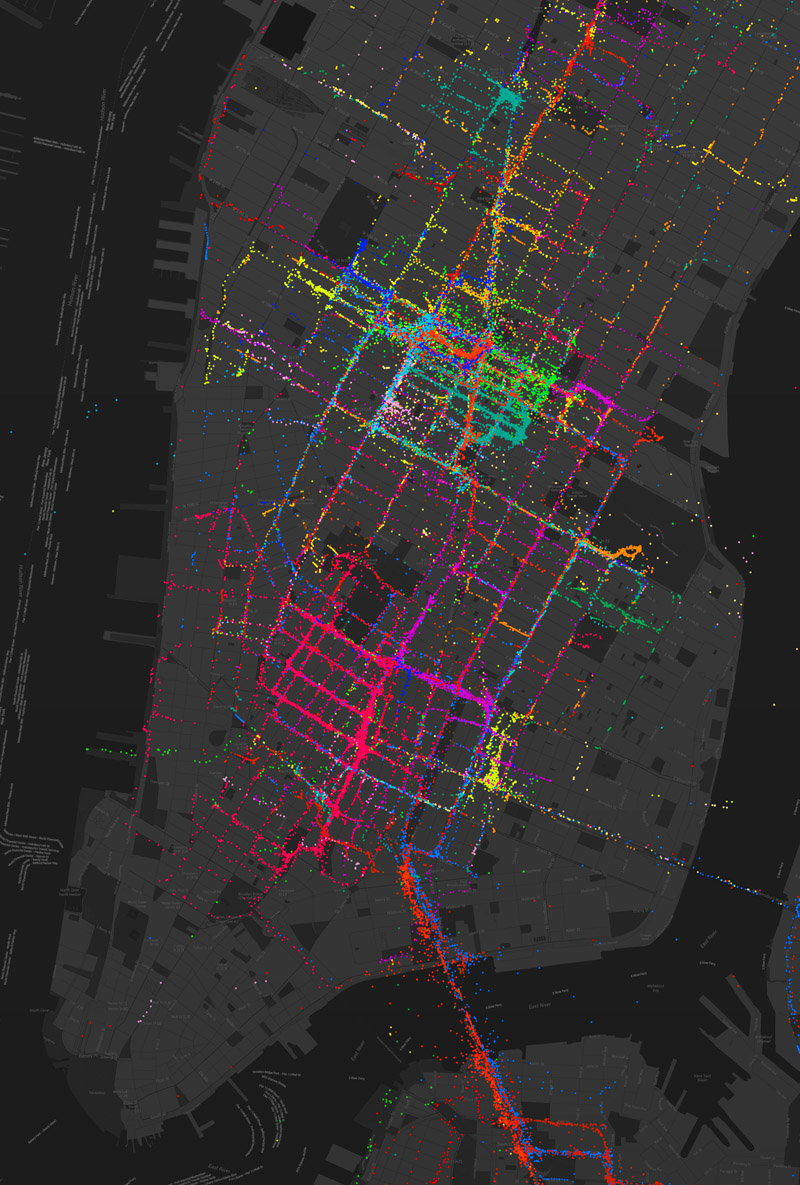
Class of 2015 - aggregate data trails
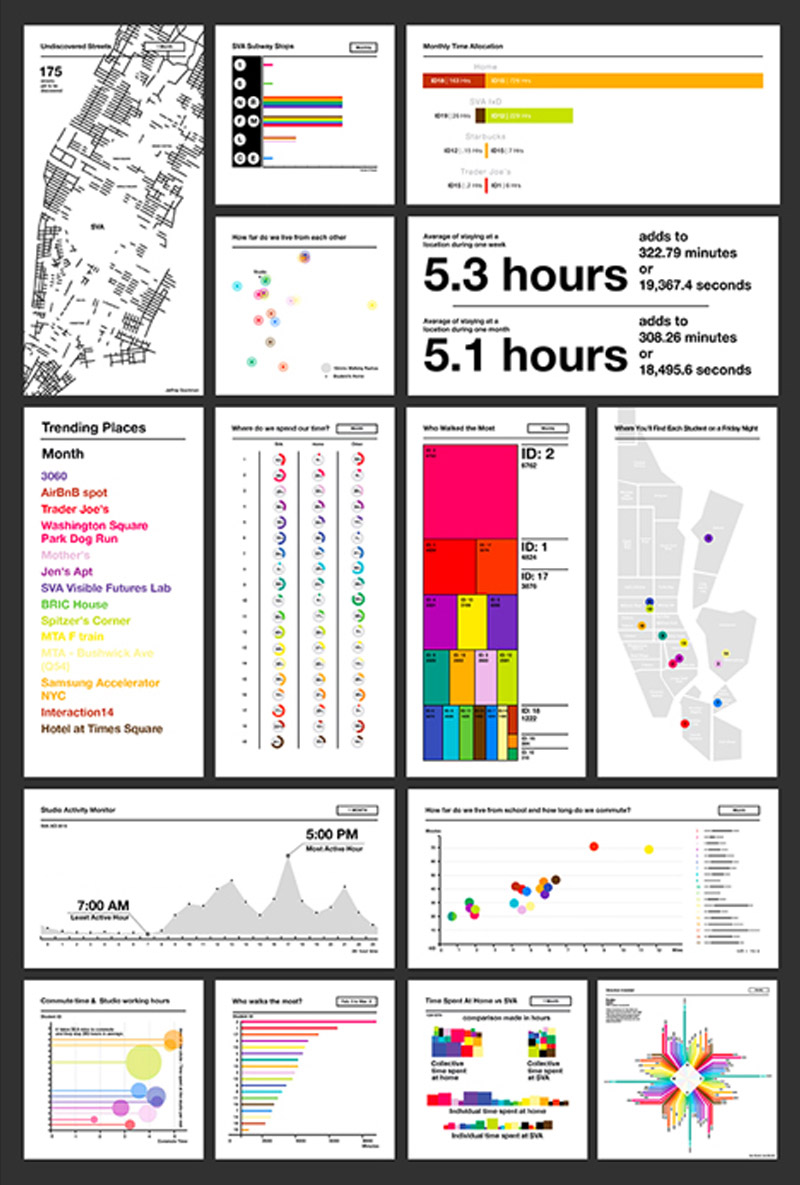
The class dashboard
Having gained an in-depth understanding of their own location data, students then explore several off-the-shelf tools to expand their research to additional everyday data sets like their own browsing history, e-mail communications, tweets or foursquare check-ins.
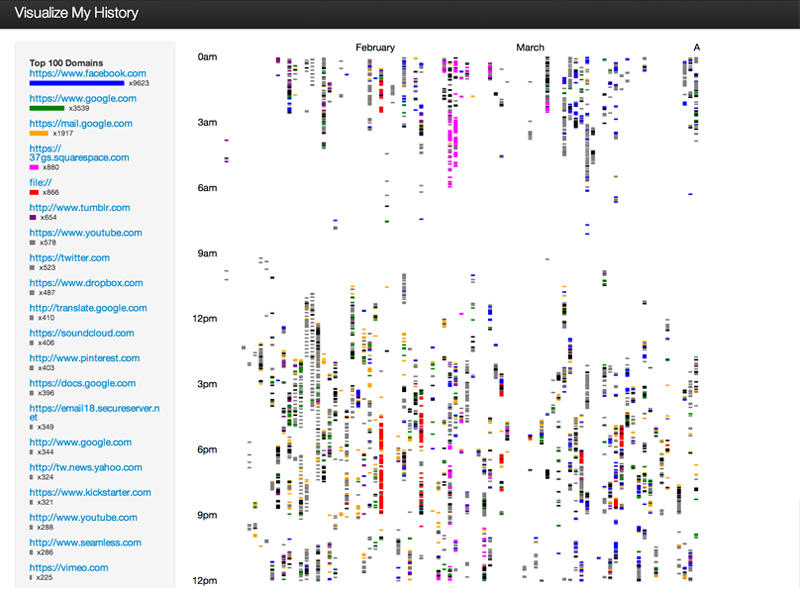
Google Chrome ‘Visualize my History’ plug-in
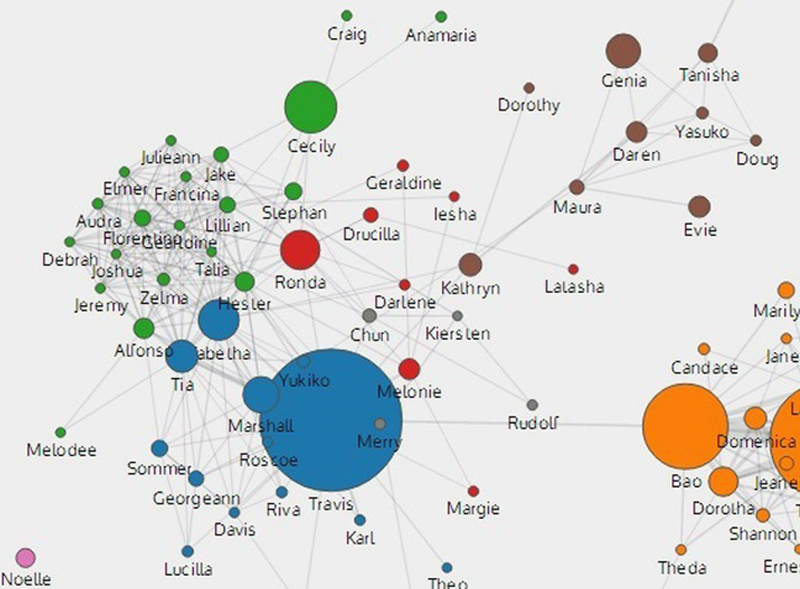
MIT Immersion Tool
Throughout the class, students develop a feel for the potentials but also the potential drawbacks and biases involved when we observe someone through their personal data.
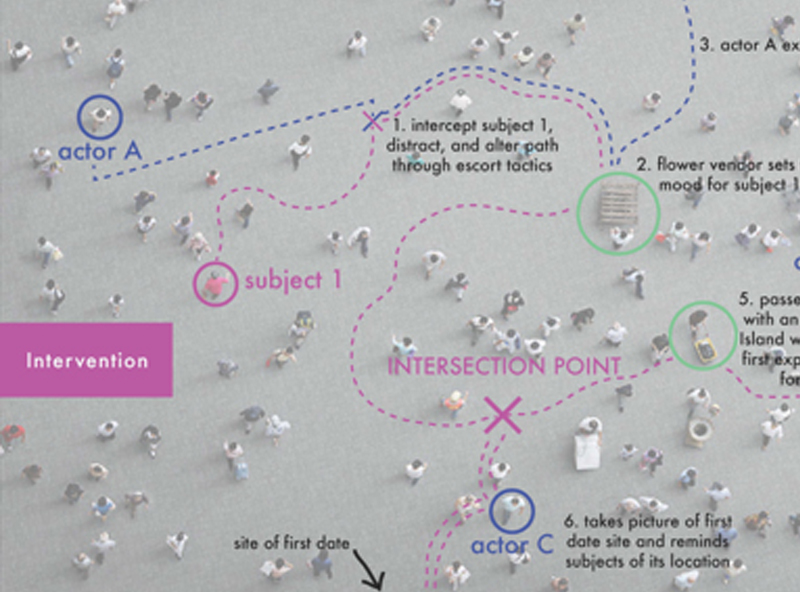
Inspired by their own experiences, students then go on to speculate on how this ubiquity of data and knowledge might impact our everyday interactions by extrapolating their insights to data-driven future "interaction stories."
Celebriplicity - Exploring new data-driven relationships between a celebrity and her fans
Generating these scenarios of our future everyday lives, the students translate their thoughts into visual scenarios and stories that provoke thoughts and spark new discussions around our potential personal data-driven futures.
Personal Ad Futures - Hypertailored advertising in public space
Passion Parties - A data-driven ‘insurance package’ to maintain a healthy relationship
After reflecting on their joint experiences and extrapolating their thinking into a visual manifestation of our future everyday data-driven existence, students also discuss these potential futures: their probabilities and benefits, but also their potential downsides.
The Urban Fictions class allows the students to develop a distinct point of view and understanding of potential benefits and drawbacks of the increasing access to our personal data.
It further builds and shapes their point of view of what their future role as designers should (or should not) entail when designing data-driven experiences, products, and services.
Student work:
Section 01 - Illustrations by Shelly Ni
Section 02 - Posters by Dami You, Trent Thompson
Section 05 - Celebreplicity: Alex Todaro, Debbie Koo, John Kim. Personal Ad Futures: Tyler Davidson, Steve Faletti.